LCPLargest Contentful Paint
Core Web VitalMeasuring
When the biggest thing on screen finished drawing.
Good: 2.50 s or less. Poor: over 4.00 s.
See this page's own speed, measured live in your browser, and what slows a site down.
I reply the same working day, in UK hours.
Or call 07935 996850 or book a call
5.0 from 31 Google reviews (checked Nov 2026)Lab 07 of 09
Lab 07 of 09
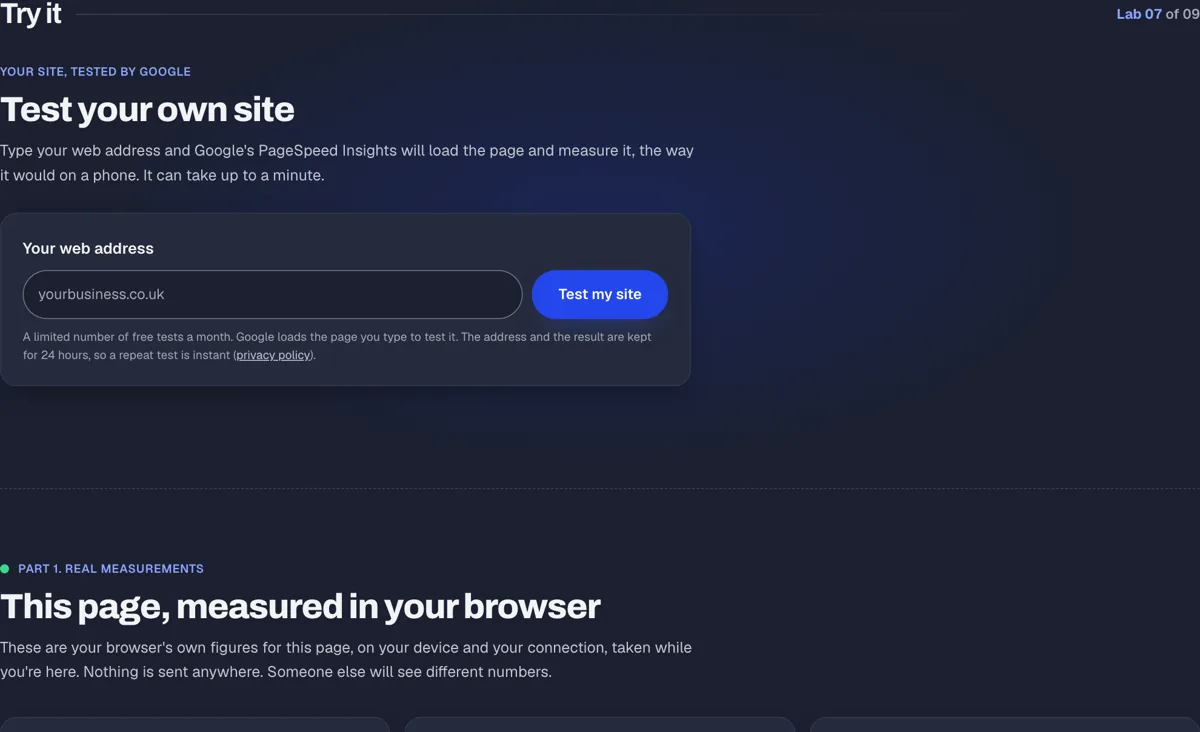
Your site, tested by Google
Type your web address and Google's PageSpeed Insights will load the page and measure it, the way it would on a phone. It can take up to a minute.
Part 1. Real measurements
These are your browser's own figures for this page, on your device and your connection, taken while you're here. Nothing is sent anywhere. Someone else will see different numbers.
When the biggest thing on screen finished drawing.
Good: 2.50 s or less. Poor: over 4.00 s.
How much the page jumped about while you were reading it.
Good: 0.10 or less. Poor: over 0.25.
How long the page took to react when you tapped, clicked or typed.
Tap, click or type anywhere on the page to measure this. Or try these:
The slow one keeps your browser busy for 300 ms on purpose, like a heavy script would.
Good: 200 ms or less. Poor: over 500 ms.
When the first words or picture appeared.
Good: 1.80 s or less. Poor: over 3.00 s.
How long the server took to start sending the page.
Good: 800 ms or less. Poor: over 1.80 s.
Measuring...
Measuring...
Good and poor lines from web.dev, checked 5 November 2026: LCP, LCP poor line, CLS, INP, FCP, TTFB. LCP, CLS and INP are the Core Web Vitals; FCP and TTFB help explain them. web.dev suggests judging a site on the 75th percentile of real visits. This is just one visit: yours.
Simulation Part 2. What slows a site down
A made-up example page, a joiner in Sunderland, on a made-up phone connection. Switch each problem on or off and the page reloads in front of you. The numbers come from a simple model of how these problems behave. They're illustrative, not measurements.
Straight off the camera at 3.4 MB, and nothing tells the browser it's important.
Loaded from another server, and the words stay hidden until it arrives.
When it lands, everything under it jumps down the screen.
900 KB from a third party, then long tasks that keep the browser too busy to respond.
Simulated Results for this example
Page weight 4.91 MB
One frame every 500 ms of the simulated load. Tap a frame to jump to it.
What the example browser downloads, and when. Striped bars hold up the first paint; the bottom row is the browser's own work.
Simulated timeline: Page HTML, 30 kilobytes, from 0.0 s to 0.3 s; Styles, 25 kilobytes, from 0.3 s to 0.5 s; Web font (blocking), 390 kilobytes, from 0.3 s to 1.3 s; Photo (unoptimised), 3400 kilobytes, from 0.5 s to 4.5 s; Heavy script, 900 kilobytes, from 0.5 s to 1.9 s; Advert, 160 kilobytes, from 1.2 s to 1.5 s. First contentful paint at 0.8 s, largest contentful paint at 4.6 s.
Part 3. Measured, not simulated
The same test on my old WordPress site and on this new build. The bar is LCP, and shorter is better. The two thin lines on each bar are web.dev's good (2.5 s) and poor (4 s) lines.
| Page | Old site (WordPress, live) | New site (built 22 Oct) |
|---|---|---|
| Home page | LCP 21.2 sFCP 3.0 s | LCP 1.75 sFCP 1.75 s |
| My blog post on website costs | LCP 12.3 sFCP 3.4 s | LCP 0.9 sFCP 0.9 s |
| A second page (cached) | LCP 5.5 sFCP 1.1 s | LCP 0.6 sFCP 0.6 s |
| Website design page | LCP 3.5 sFCP 2.6 s | Not measured |
| Care+ page | LCP 6.0 sFCP 6.0 s | Not measured |
Measured on 23 October 2026 with Lighthouse's mobile settings (a throttled phone: 150 ms latency, 1.6 Mbps, 4× slower CPU), the median of 3 runs. The same method on both sites, so the numbers compare. The old site was the live WordPress site; the new one was the build from 22 October. Your own visit, in Part 1, will differ.
The numbers are your browser's own measurements of this page, taken while you're on it.
The second part is a simulation: a made-up page and made-up numbers, so you can see what each common problem does.

I reply the same working day, in UK hours.
Or ring 07935 996850. If I can't pick up, leave a message or WhatsApp me.